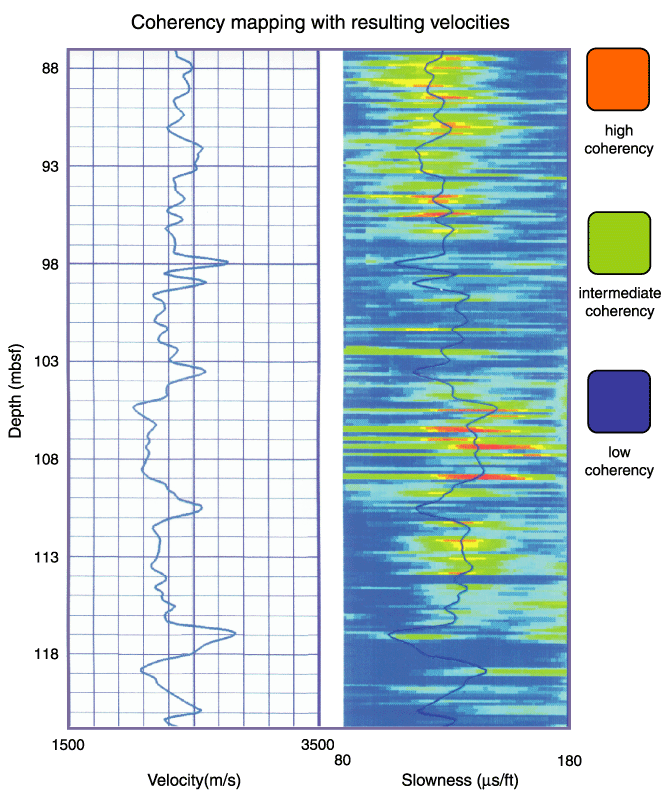
Figure F6. Example of digital coherency mapping performed with data of logging run two. The digital coherency mapping is based on the tracking of highly coherent velocity values. The coherency values within the slowness range (80-180 Ás) are color coded (right side of figure). The resulting velocity values are shown on the left side.

![]()