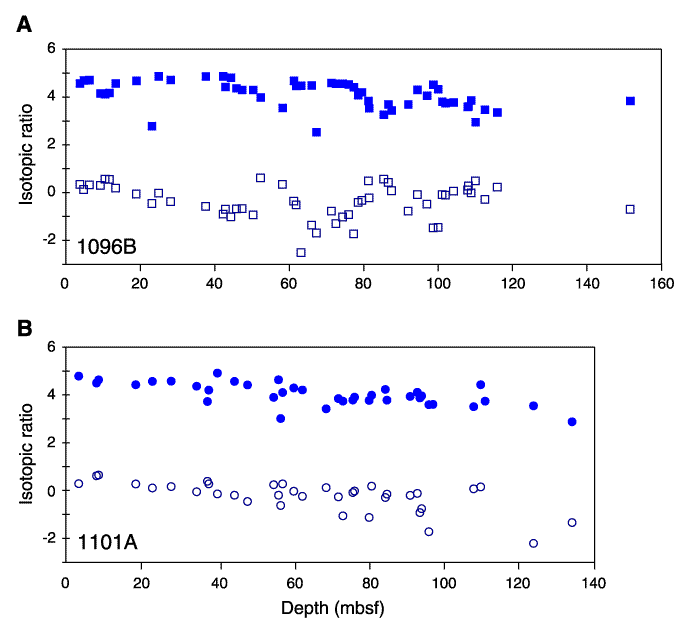
Figure F1. Oxygen (solid symbols) and carbon (open symbols) isotopic ratios from Tables T1 and T2 plotted against depth in (A) Hole 1096B (squares) and (B) Hole 1101A (circles).