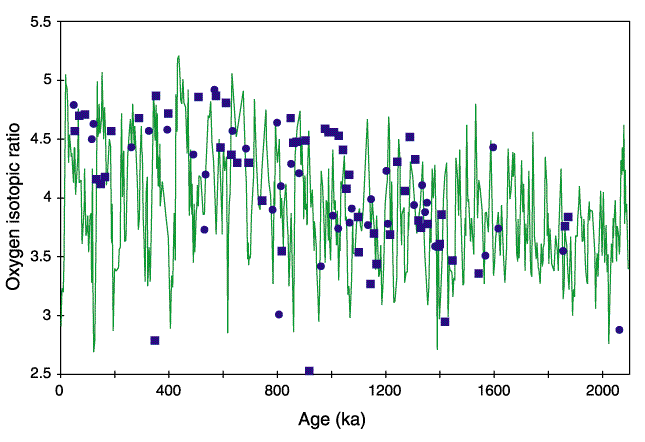
Figure F2. Oxygen isotopic ratios from Holes 1096B (squares) and 1101A (circles) compared with detailed measurements (green) on benthic foraminifers at ODP Site 659 (Tiedemann et al., 1994). There is general coincidence between the detailed curve and the range of values measured at Sites 1096 and 1101. Exact correlation is not intended.
