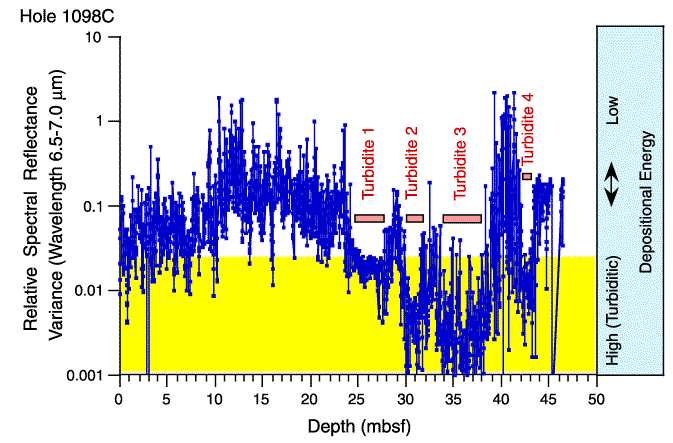
Figure F2. The variance of the measurements taken in the wavelength window (7.0-6.5 Ám) as an indicator for the character of signal absorption is shown vs. depth for Hole 1098C. Low variance values document intervals of a high depositional energy facies (turbidites 1 to 4), whereas high variance values document intervals low depositional energy facies.

![]()