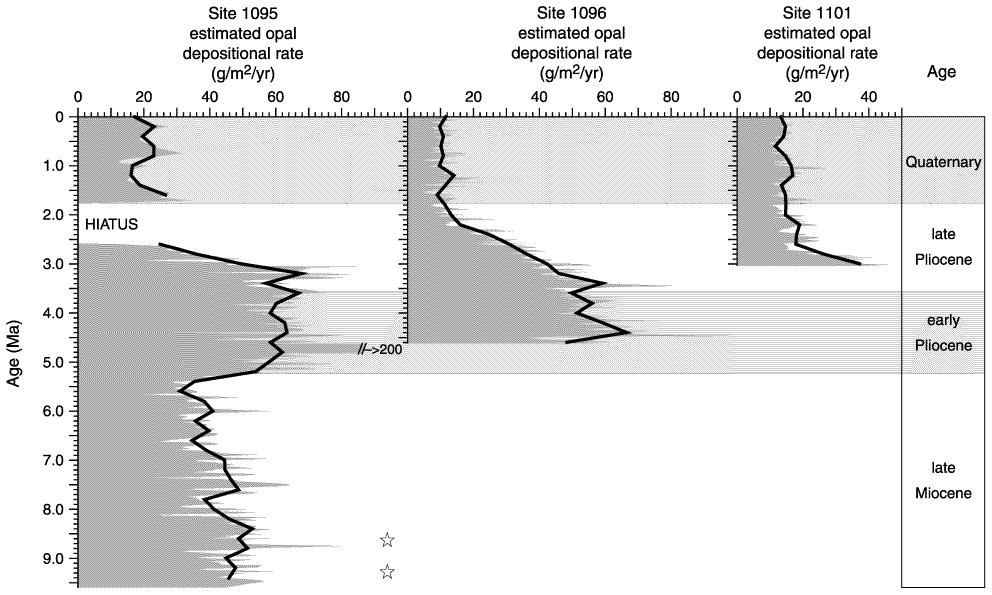
Figure F8. Estimated opal depositional rates (shaded) for sediments recovered at Sites 1095, 1096, and 1101 plotted vs. age. The bold lines depict opal depositional rates linearly integrated at time increments of 200 k.y. Stars at Site 1095 mark time intervals for which the opal depositional rates were equated with the opal accumulation rates (MARopal).

![]()