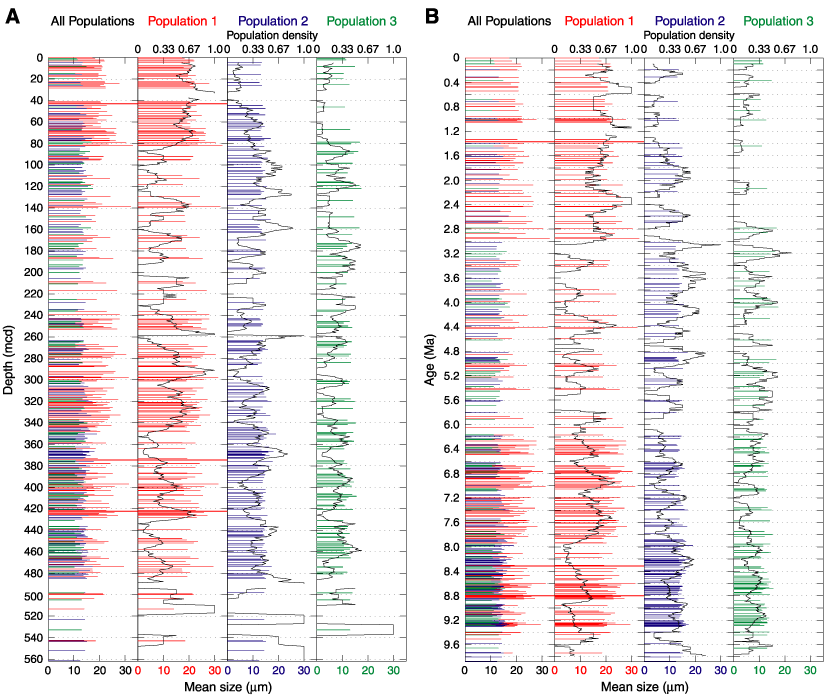
Figure F12. Downhole plots of the three sortable silt populations vs. (A) depth and (B) age. The populations are color coded, and the amplitude refers to the mean grain size. The black curves for each population represent the density of the occurrence of the specific population normalized to the total number of samples within a 10-m depth or 0.2-Ma time window.

![]()