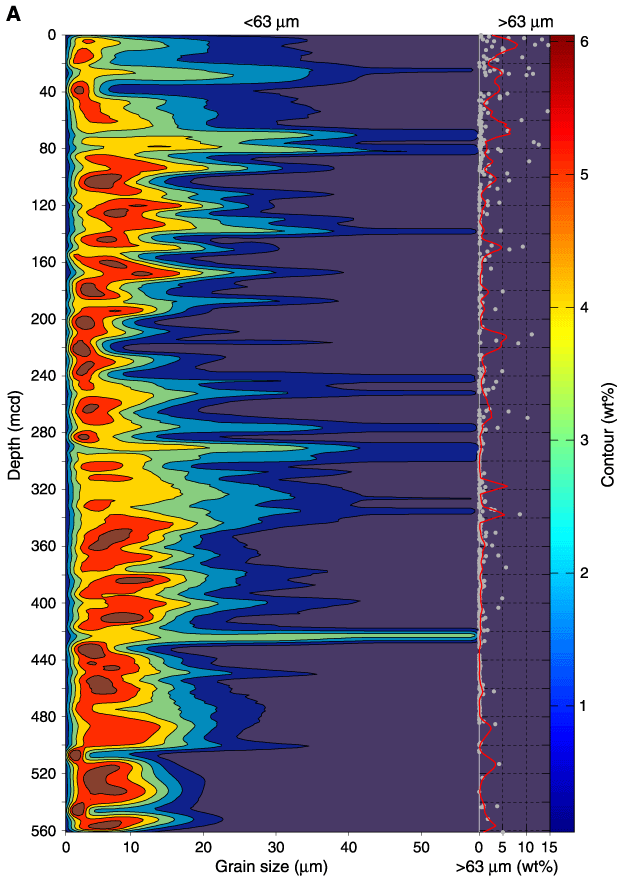
Figure F6. A. Contour plots of the fine-fraction data vs. depth. The contour algorithm chosen is linear and resolves six contour levels representing the percent of sediment found for each grain-size class. Percent values refer to the total sediment sample dry mass. The size fraction >63 Ám was added as an undifferentiated two-dimensional summary curve as a separate column at the right side of the graph. Single data values and a zero-phase filtered curve are given for the >63-Ám fraction.

![]()