Figure F6 (continued).
B.
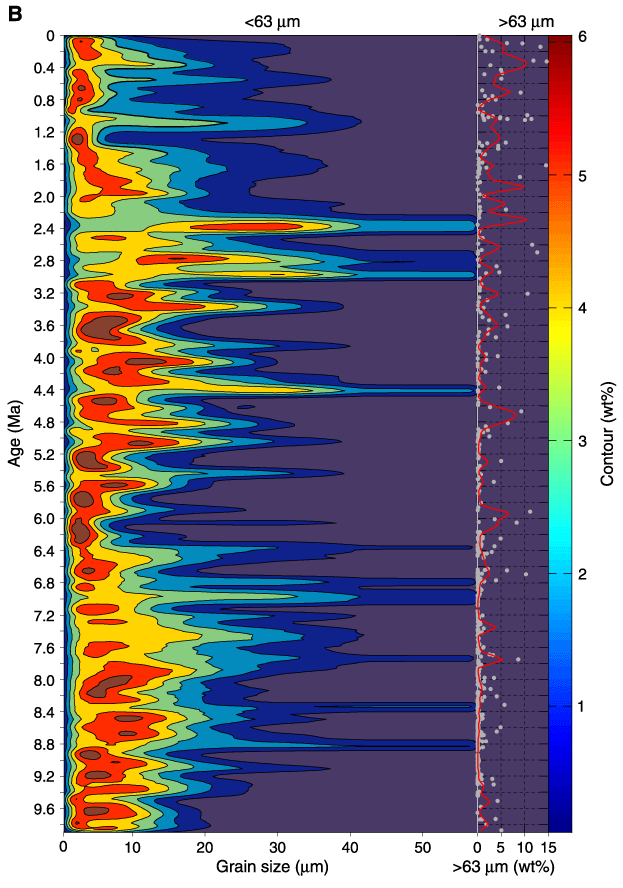
Contour plots of the fine-fraction data vs. age.