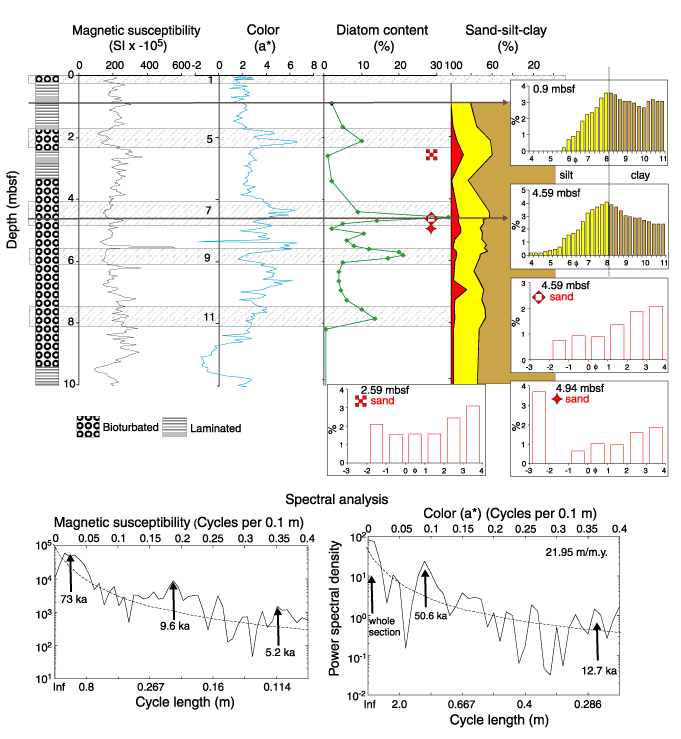
Figure F5. Late Quaternary, 0-0.4 Ma (0-10 mbsf). The core log at the left shows the occurrence of bioturbated and laminated intervals. Warm isotope stages are delineated using the presence of diatoms, supplemented by the occurrence of the diatom Hemidiscus karstenii at 4.6 mbsf (Stage 7; Shipboard Scientific Party, 1999) and the radiolarian Stylatractus universus at 7.84 mbsf (Stage 11; this work). Magnetic susceptibility is low in Stages 5, 7, and 9 and higher and more variable in Stages 2-4, 6, and 10 downward. Color parameter a* is higher in the brown intervals of Stages 5, 7, and the upper part of 9.
The grain-size pattern is less obviously cyclic at this distal site with a low sedimentation rate than at core sites higher on the drift (Pudsey and Camerlenghi, 1998). Most samples have a weak mode near the silt/clay boundary of 4 Ám (8  ). Glacial samples consistently have less coarse silt than interglacial samples (compare histograms at 0.9 and 4.49 mbsf). The three sand histograms at 2.29 mbsf (Stage 2), 4.59 mbsf (Stage 7), and 4.94 mbsf (Stage 8) show that coarse, unsorted sand occurs in glacials as well as interglacials.
Spectral analysis, shown in the lower panel, reveals weak peaks of power spectral density at 73, 9.6, and 5.2 ka in magnetic susceptibility and 50.6 ka in chromaticity a*. The units of power spectral density are for color, (chromaticity)2 per cycle per 0.1 m, and for magnetic susceptibility, (SI units)2 per cycle per 0.1 m.

![]()