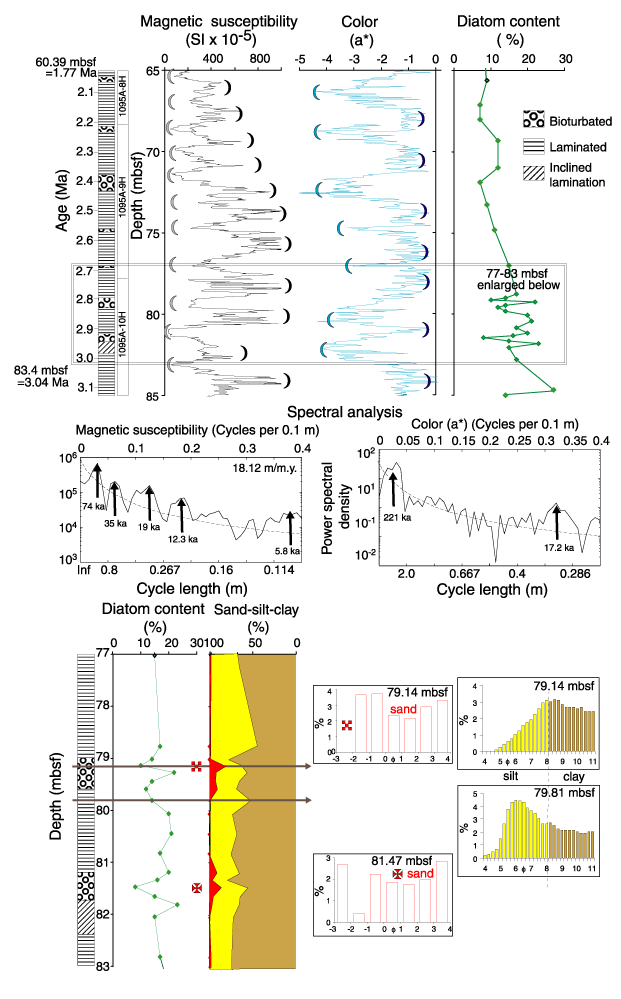
Figure F6. Late Pliocene, 2-3 Ma (65-85 mbsf). The core log at the left shows the occurrence of bioturbated and laminated intervals. Inclined bedding from 81.7 to 82.4 mbsf may result from slumping. Magnetic susceptibility shows, to the human eye, cyclicity at approximately a 100-k.y. period (11 peaks in 1.1 m.y.; peaks and troughs marked by black and gray curve symbols). Color parameter a* shows 7 peaks in 1.1 m.y., with troughs of varying thickness (blue curve symbols). This corresponds to a period of 160 k.y. Bioturbated units occur at the top of each trough; they constitute the whole of the thin troughs at 74.8 and 77 mbsf. The color cycles do not show a consistent phase relationship to magnetic susceptibility.
Spectral analysis, shown in the middle panel, reveals peaks of power spectral density at 74, 35, 19, 12.3, and 5.8 ka in magnetic susceptibility and 221 and 17.2 ka in color parameter a*.
The lower part of diagram shows part of Core 178-1095A-10H demonstrating relationship of diatom percentage and grain size to bioturbated and laminated facies, with representative grain-size frequency histograms.

![]()