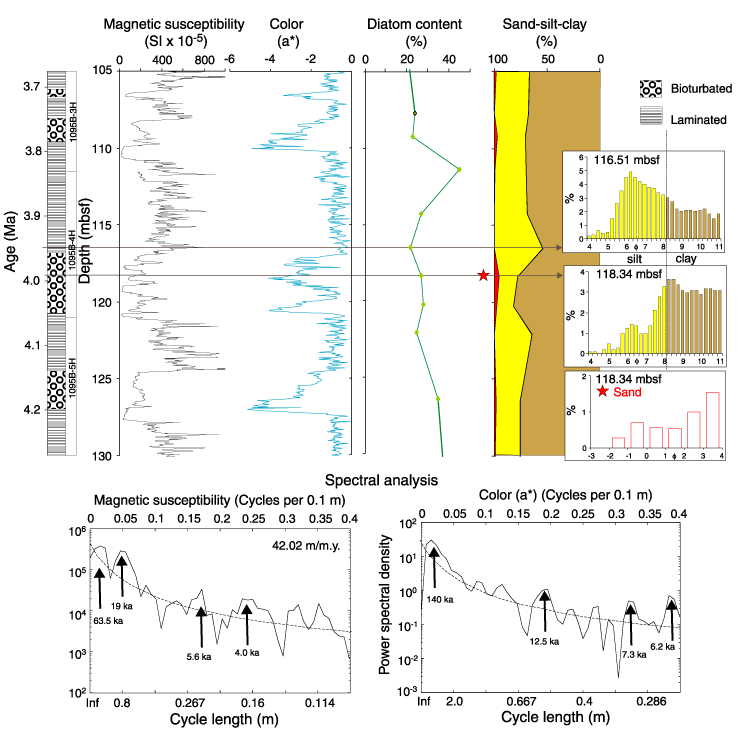
Figure F7. Early Pliocene, 3.7-4.3 Ma (105-130 mbsf). The core log at the left shows the occurrence of bioturbated and laminated intervals. Magnetic susceptibility and color (a*) both have lower values in the bioturbated intervals (bioturbated intervals are greener and laminated intervals grayer). Intervals containing lighter-colored silts at 110-110.4 and 127-127.9 mbsf have low susceptibility. Fine fraction size distributions from the laminated facies typically have a mode in the silt range (histogram at 116.51 mbsf). The bioturbated facies contains poorly sorted sand and very little silt (histograms at 118.34 mbsf).
Spectral analysis, shown in the lower panel, reveals weak peaks of power spectral density at 63.5, 19, 5.6, and 4.0 ka in magnetic susceptibility and 140, 12.5, 7.3, and 6.2 ka in chromaticity a*.

![]()