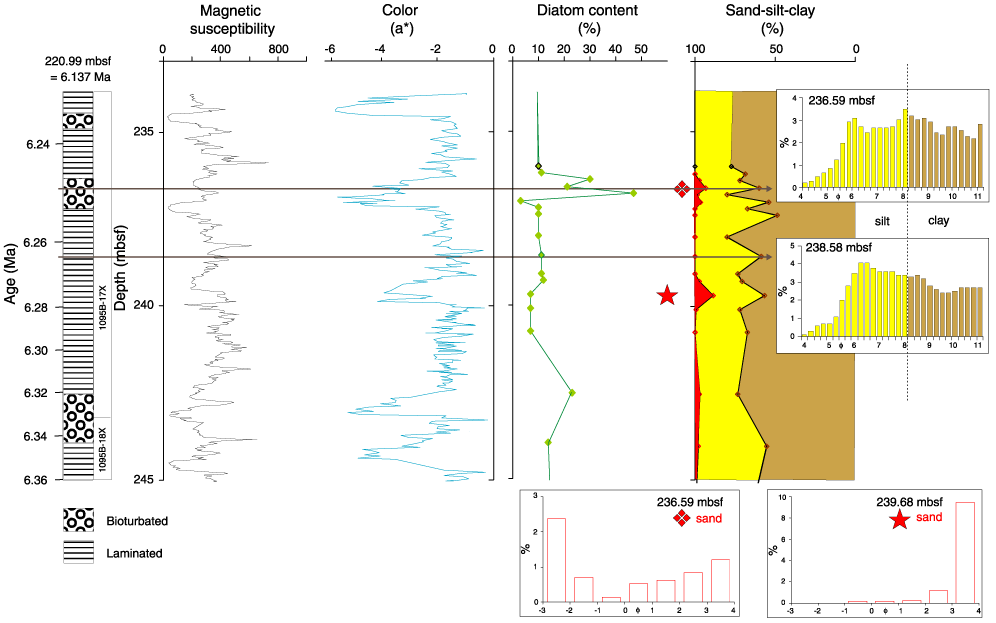
Figure F8. Late Miocene, 6.23-6.36 Ma (234-245 mbsf). The core log at the left shows the occurrence of bioturbated (circular ornament) and laminated intervals. Magnetic susceptibility and color (a*) both have lower values in the bioturbated intervals (bioturbated intervals are greener and laminated intervals grayer). The sandy, low-a* interval just above 240 mbsf is not bioturbated (from shipboard core description and inspection of core photograph) and does not have high diatom content. Spectral analysis was not performed for this interval because there is a change in sedimentation rate in the middle.

![]()