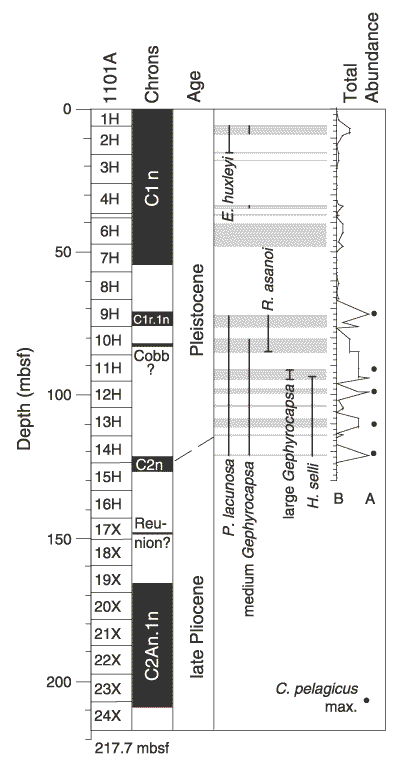
Figure F3. Illustration of biostratigraphic ranges of calcareous nannofossil species from Hole 1101A. Black bars = normal polarity chrons. Gray horizontal bars = intervals in which nannofossils were observed. The graph to right shows total abundance of assemblage: left = barren, right = abundant. Black dots indicate samples with maximum abundances of C. pelagicus.

![]()