Figure F1 Table T1 Plates P1-P2
F1. Sr isotope vs. calculated age.
Table T1
T1. Sr isotope data for barnacles.
Plates P1-P2
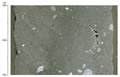
P1. Photograph of barnacle with intact shell.
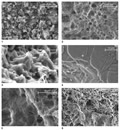
P2. SEM images of barnacle fragments.