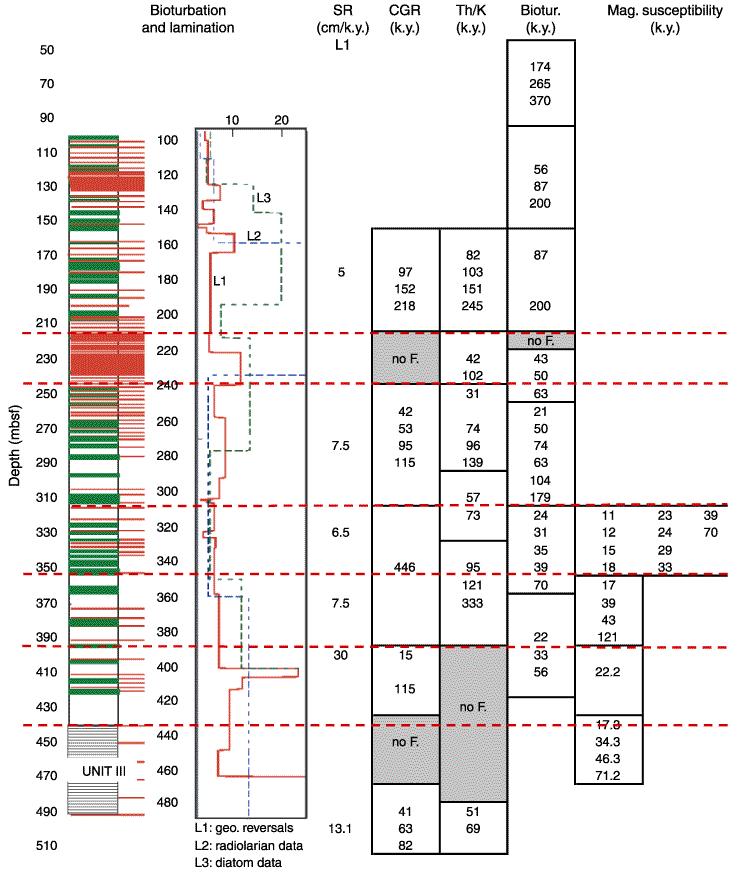
Figure F12. Hole 1095B. Synthesis combining all the results from Figures F8 and F10 and Table T1. On the left, the master lithostratigraphic column of Hole 1095B shows dominant lithology (from Shipboard Scientific Party, 1999b). Black color is for bioturbated intervals, and white, for fine-grained turbidite facies. On the right, the main periods and their depth of appearance are summarized for the natural gamma ray and the thorium/potassium ratio logs (labeled CGR and Th/K), the bioturbated intervals (labeled silts), and the core magnetic susceptibility. SR = sedimentation rate, no F. = no frequency.


![]()