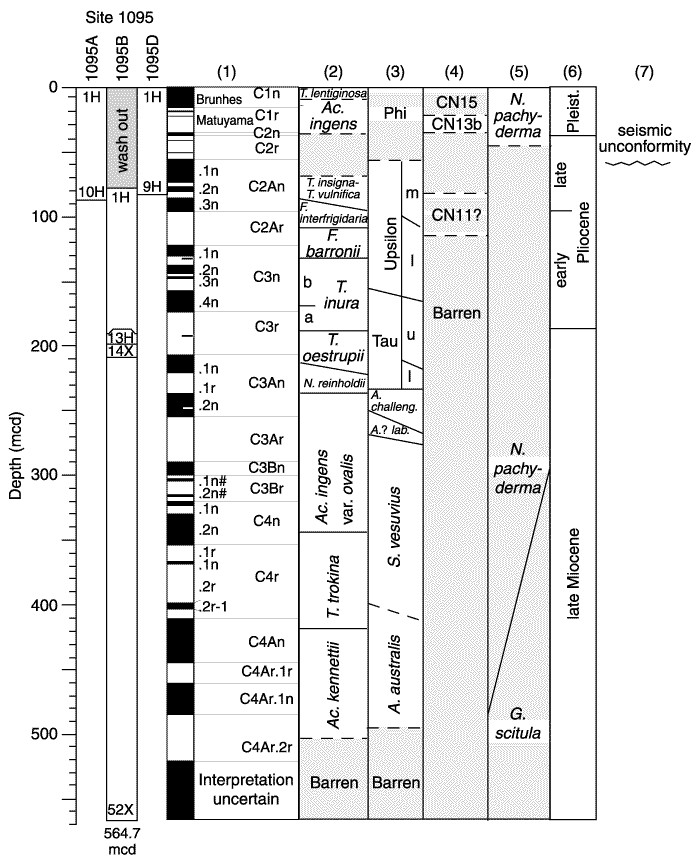
Figure F3. Magnetostratigraphic and biostratigraphic summary of Site 1095. A zonal boundary which was identified to within one core is shown by a horizontal solid line. Dashed lines are used for more tentative event positions. 1 = Acton et al., Chap. 37, this volume, 2 = Winter and Iwai, Chap. 29, this volume; Iwai, 2000a, 2001, 3 = Lazarus, Chap. 13, this volume, 4 = Iwai et al., Chap. 28, this volume, 5 = Osterman in Barker, Camerlenghi, Acton, et al., 1999, 6 = Berggren et al., 1995, 7 = wavy lines represent a seismically identified uncomformity (Barker, Camerlenghi, Acton, et al., 1999).


![]()