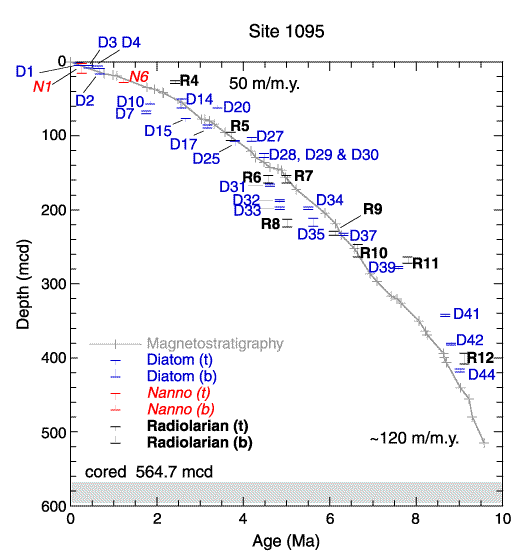
Figure F6. Age-depth profile at Site 1095 with magnetostratigraphic and biostratigraphic events and correlation to the GPTS. Crosses mark magnetostratigraphic events from Table T7
as interpreted by Acton et al. (Chap. 37, this volume) and discussed in
"Data Sources: Magnetobiochronology of Leg 178 Rise Sites."
Biostratigraphic events are from Table T4. At the plot scale shown, most events are located precisely enough that triangles overlap. D = diatom event code, R = radiolarian event code, N = calcareous nannofossil event code. (t) = top, (b) = bottom. Biostratigraphic event codes are given in Table
T2. Approximate average sedimentation rates are shown in meters per million years.


![]()