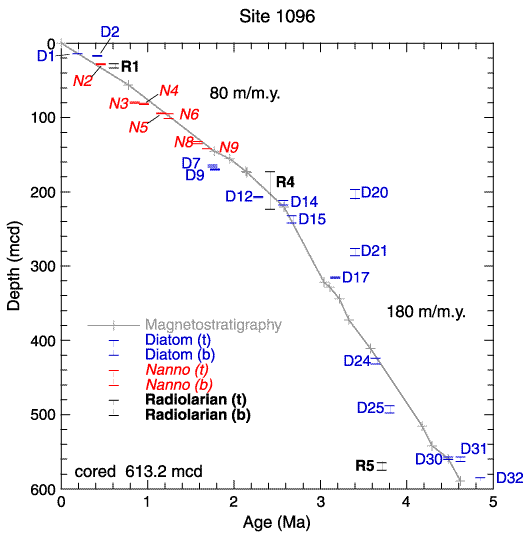
Figure F7. Age-depth profile at Site 1096 with biostratigraphic events. Data are from Tables T5 and
T7. At the plot scale shown, most events are located precisely enough that triangles overlap. D = diatom event code, R = radiolarian event code, N = calcareous nannofossil event code. (t) = top, (b) = bottom. Biostratigraphic event codes are given in Table
T2. Approximate average sedimentation rates are shown in meters per million years.


![]()