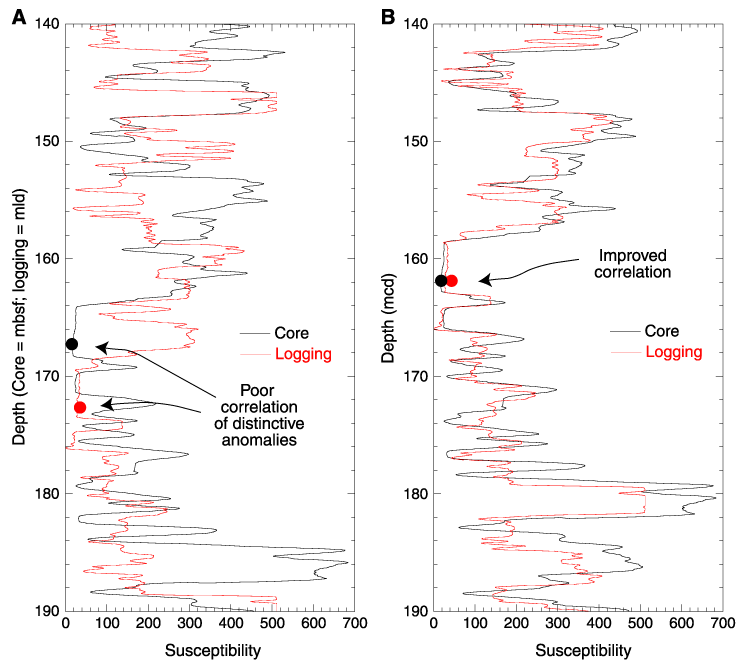
Figure F14. A, B. Susceptibility data from whole-core measurements (black) and from the second run of the GHMT logging tool (red). The core susceptibility data are plotted in the mbsf depth scale, which is estimated from the length of the drill pipe, and the logging susceptibility data are in the meters logging depth (mld), which is estimated from the length of the logging wireline. Both the core and logging data are plotted on the mcd depth scale using the offsets giving in Table T16. This results in a notable improvement in the correlation of distinctive anomalies, such as those in the vicinity of the red and black dot. The logging susceptibility data have been divided by nine to scale them to the core susceptibility data. Core susceptibility is given in raw meter units, which can be converted to SI volume units when the raw values are multiplied by ~0.7 x 10⁻⁵. Both susceptibility data sets have been smoothed. The peak values for the logging data never exceed ~500 in the plot, owing to the dynamic range of the logging tool.


![]()