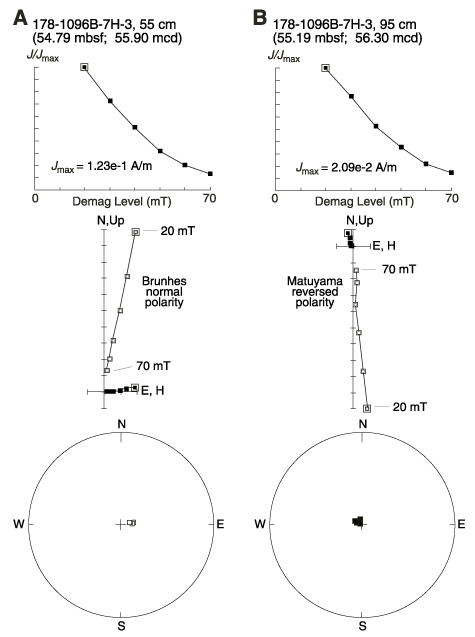
Figure F3. AF demagnetization results for two intervals from U-channel samples from Site 1096. See Figure F2
for plot descriptions. Both intervals are from archive-half sections that had previously been subjected to demagnetization at 20 mT, and so the demagnetization of the U-channel samples was started at 20 mT. A. Sample 178-1096B-7H-3, 55 cm. B. Sample 178-1095B-7H-3, 95 cm.