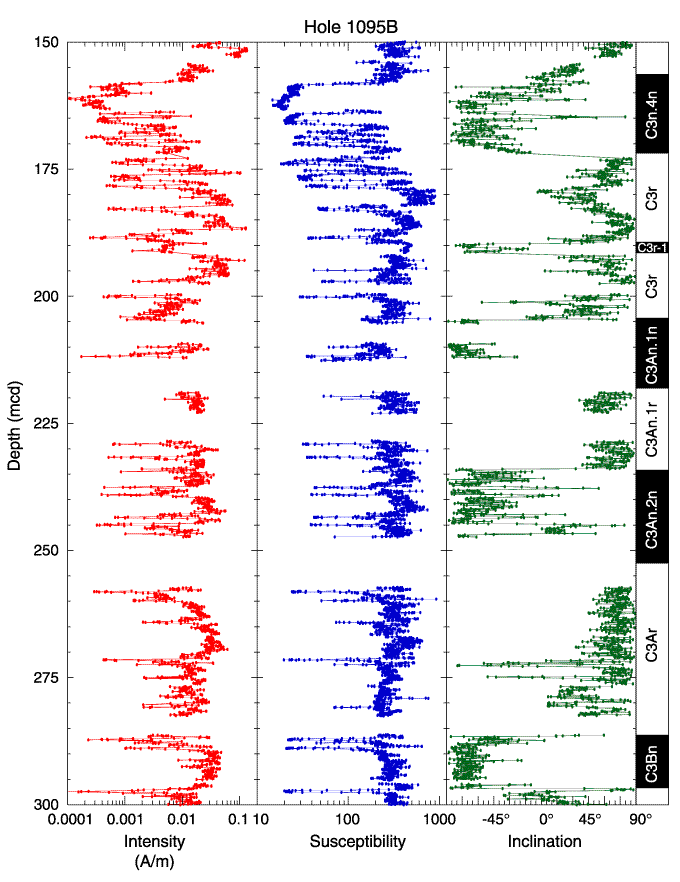
Figure F6. The notable susceptibility lows are shown for an interval from 150 to 300 mcd in Hole 1095B. Susceptibility is given in raw meter units, which can be converted to volume SI units by multiplying by ~0.7 x 10⁻⁵. The magnetic polarity (black = normal, white = reversed) and interpreted chrons are given to the far right.


![]()