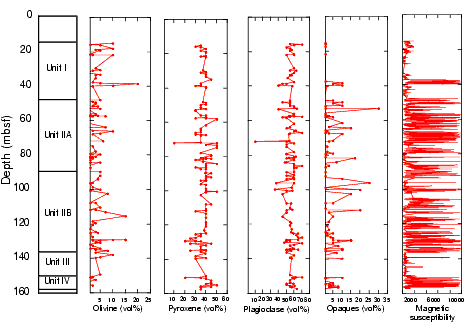
Figure F22. The downhole variation in modal mineralogy (in volume percent) of Hole 1105A as visually estimated during core description. The values represent averages of individual intervals. The magnetic susceptibility measured on the whole core is illustrated for comparison, particularly with Fe-Ti oxide contents and definition of unit boundaries (see "Physical Properties"). Opaques include Fe-Ti oxides and sulfides.

![]()