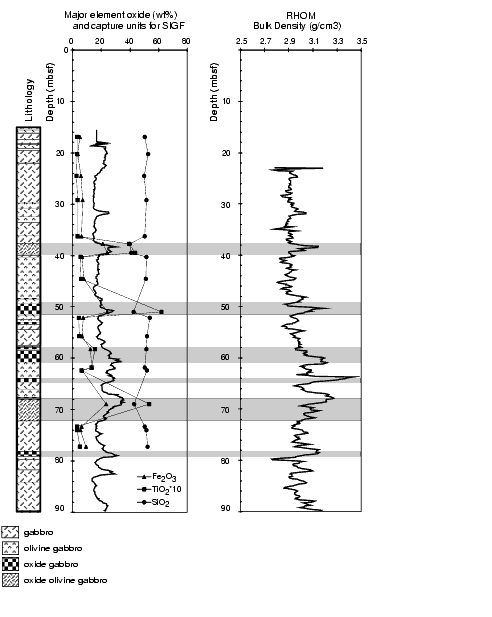
Figure F81. Composite diagram of the first 90 mbsf showing the relations between the SIGF from the APS tool, corresponding to the measure of the formation capture cross section of thermal neutrons and core geochemical analysis. In track 2, the RHOM is presented. High values of density are coherent with both the oxide gabbro intervals described in the cores and the SIGF high values.

![]()