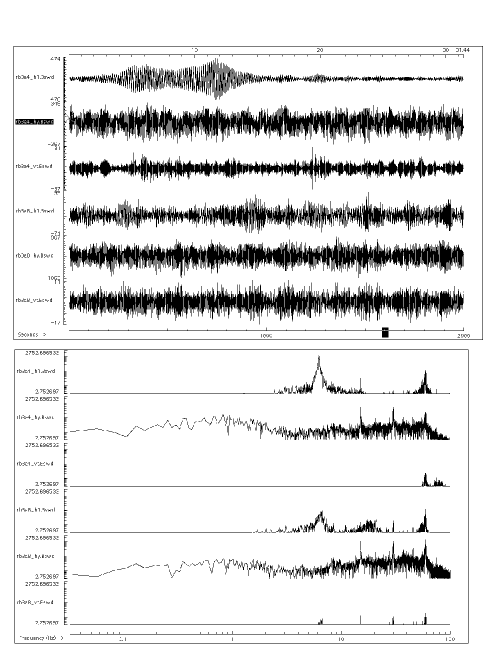
Figure F85. Time series (upper panel) and spectra (lower panel) for a 31-s sample while not drilling in Hole 1105A. In each case, the upper three traces are from the OBS nearer the hole, and the lower three from the far OBS. Note the differing amplitude scales for each trace.

![]()