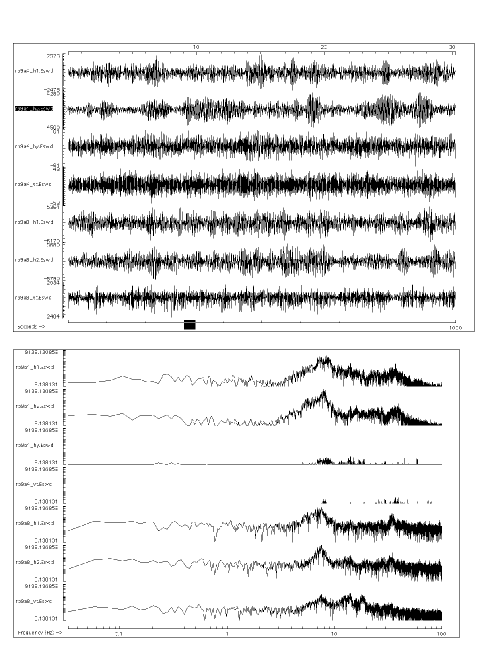
Figure F8. A 30-s sample of the time series (upper) and spectra (lower) during drilling in basement at 398 m. In each case, the lower three traces are the nearer seismometer, and the upper four the far seismometer. Note the differing amplitude scales for each trace.
