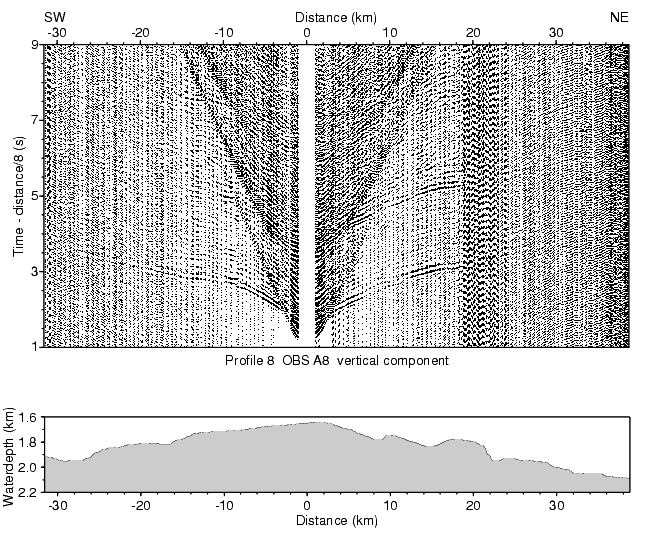
Figure F10. Travel-time/distance plots for each of the components recorded by OBSs #A4 and #A8 during shooting of profile P8. The data are band-pass filtered from 2/6 to 16/24 Hz, and the level plotted is proportional to offset. The seafloor topography is shown at the bottom. (Continued on next three pages.)
