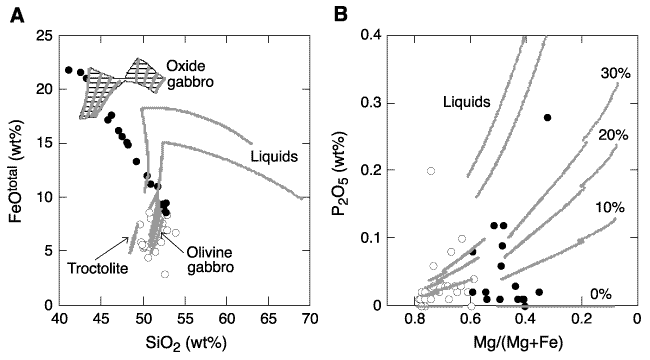
Figure F26. Compositions of bulk gabbros compared to modeled liquid line of descent (liquids) and solid fractionates (troctolite, olivine gabbro, and oxide gabbro). A. FeO vs. SiO2 with all iron calculated as total FeO. Two modeled liquid trends are shown for slightly different analyses of the same sample 5-3 as given by Natland et al. (1991) and Johnson and Dick (1992), respectively. The highest iron enrichment results from the analysis of Johnson and Dick (1992). The calculated liquid line of descent for the analyses given by Natland et al. (1991) is summarized in Table T8. B. P2O5 vs. Mg/(Mg + Fe) with iron calculated as total Fe. The solid fractionates are given with 30%, 20%, 10%, and 0% trapped liquid. The higher the trapped liquid, the closer to the liquid line of descent will the solid fractionate plot. The segmentations in the solid fractionate are caused, respectively, by the income of augite and Fe-Ti oxide minerals and by the fall-out of ilmenite as a result of liquid depletion in TiO2. Note that the scale for P2O5 has been truncated at 0.4 wt% and that the diagram does not include samples with high amounts of cumulus apatite. See text for calculation methods and discussion.


![]()