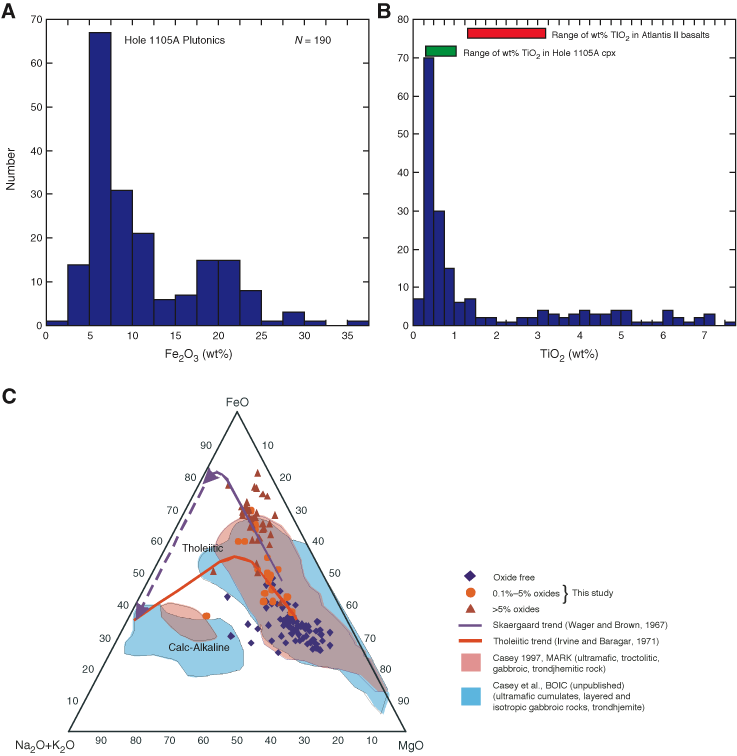
Figure F13. A. Histogram of whole-rock Fe2O3 (total iron as Fe2O3) abundances from 148 Hole 1105A samples analyzed by inductively coupled plasma–atomic emission spectroscopy (ICP-AES) showing extreme enrichment in iron. B. Histogram of whole-rock TiO2, also showing parallel enrichment with Fe. Range of TiO2 in Hole 1105A clinopyroxene (cpx) (this study) and Atlantic II basalts (Johnson and Dick, 1992) also shown for reference C. Alkali-iron-magnesium (AFM) plot showing the distribution of FeO, MgO, and Na2O + K2O in the gabbroic rocks from Hole 1105A. Samples are color-coded on the basis of modal abundances of oxides in the gabbroic rocks. Polygons show the data extent of the Kane Fracture Zone area of the Mid-Atlantic Ridge (MARK) (Casey, 1997) and Bay of Islands gabbroic and ultramafic cumulates (BOIC; J.F. Casey, unpubl. data), as well as the Skaergaard (Wager and Brown, 1967) and generalized tholeiitic (Irvine and Baragar, 1971) trends.


![]()