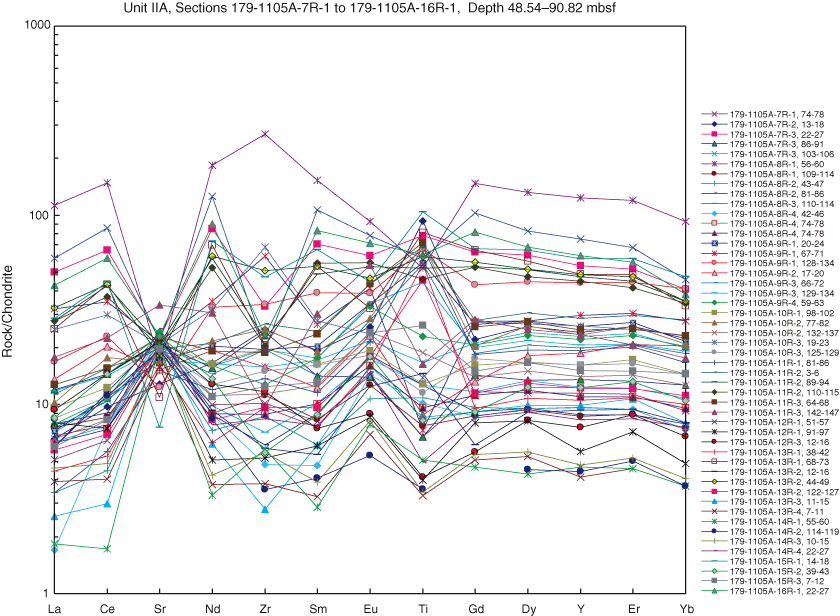
Figure F17. Extended rare earth element (REE) spidergrams showing chondrite-normalized trace element abundances of gabbroic rocks from Subunit IIA. Samples in top plot are from the highest level of the unit, and the basal plots show progressively lower levels of the core. Normalization values after Anders and Grevesse (1989).


![]()