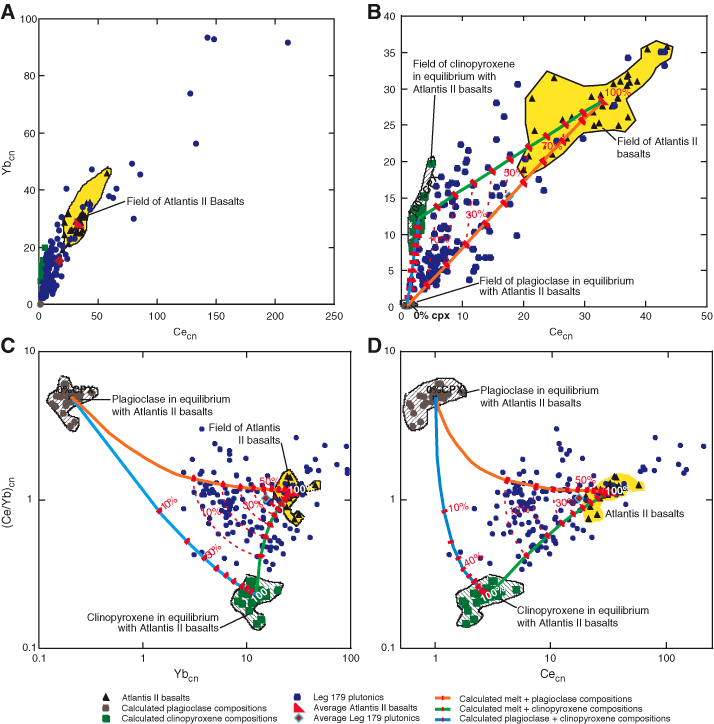
Figure F23. A, B. Cross plots between chondrite-normalized Ce and Yb showing Atlantis II mid-ocean-ridge basalt (MORB) (Johnson and Dick, 1992), the compositions of clinopyroxene and plagioclase calculated to be in equilibrium with the basalts, and Hole 1105A gabbroic rocks. B is an enlarged view of A to show the positions of most of the gabbroic rocks as more depleted than basaltic rocks, yet more enriched than expected of an adcumulate mixture of plagioclase and clinopyroxene. Note that the abundance of these incompatible trace elements lies above the values along a mixing line between the average plagioclase and clinopyroxene cumulate, likely indicating that most samples contain some trapped melt. C, D. (Ce/Yb)cn ratio vs. Ybcn and Cecn. Also plotted are the Atlantis II basalts. Plagioclase and clinopyroxene in equilibrium with Atlantis II basalts tie lines show various mixing proportions of basalt (liquid), cumulate plagioclase, and clinopyroxene. Contours show the percentage of trapped melt that could be contained in the primitive gabbroic rocks. The estimation breaks down during advanced fractionation and if accessory phases such as apatite and zircon accumulate or if granophyric veins impregnate the gabbroic rocks. Then, as shown, the gabbroic rocks may be more enriched than the basalt. More quantitative "trapped" melt estimates for each rock will be presented in J.F. Casey and N.R. Banerjee (unpubl. data).


![]()