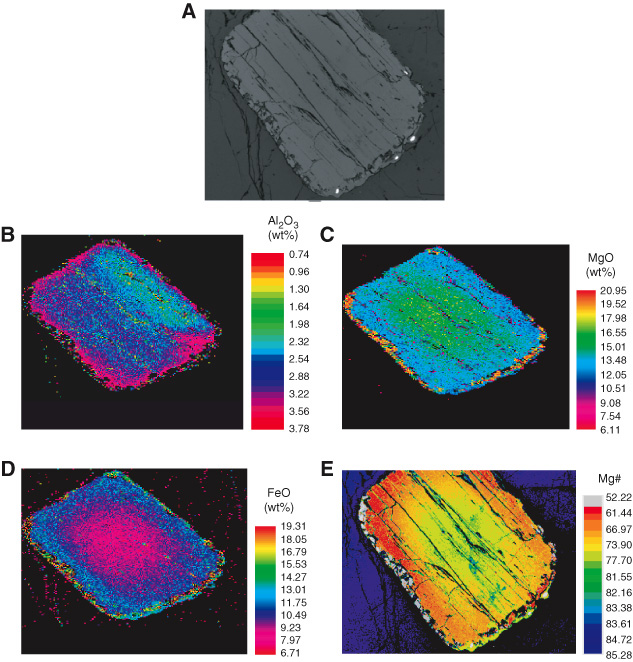
Figure F28. A. Backscatter image of a clinopyroxene grain in Sample 179-1105A-19R-4, 18–23 cm, mapped for elemental abundances. B–E. False-color Al, Mg, Fe, and Mg# maps of the same grain. False-color images are made using National Institute of Health (NIH) image software. Prominent normal zoning is shown in the grain. Values for corresponding colors are shown in the legend. This is an example of fractionated clinopyroxene rim on Type 1 core.