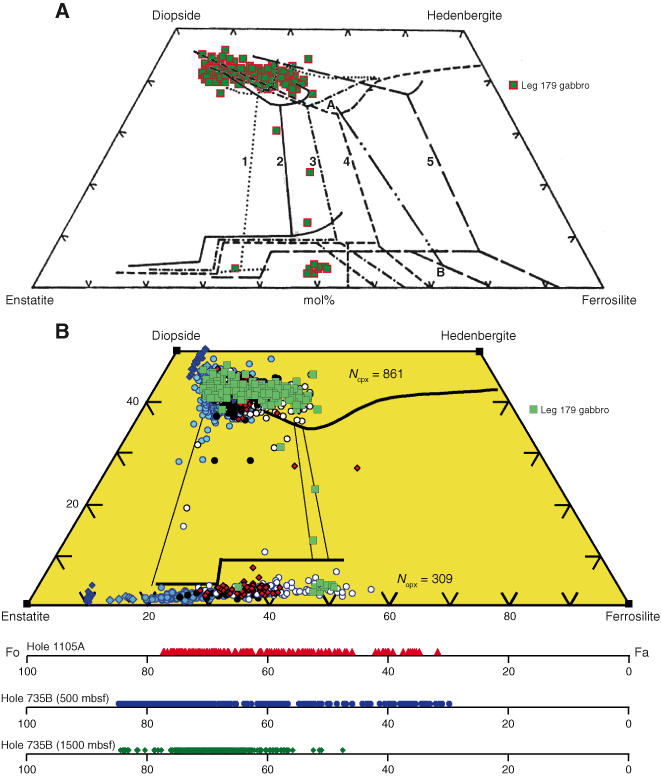
Figure F30. A. Pyroxene quadrilateral plot from Campbell and Nolan (1974) showing pyroxene minima of different layered intrusions: Sudbury = 1, Jimberlana = 2, Skaergaard = 3, Bushveld = 4, Bjerkrem-Songdal = 5. Superimposed green symbols represent pyroxene data from Hole 1105A (this study). B. Pyroxene quadrilateral plot showing the Skaergaard trend (black lines). Also plotted is pyroxene data from Hole 1105A (green symbols) on top of data from Hole 735B with the following color scheme: dark blue = troctolites, light blue = olivine gabbro, red = gabbro, white = oxide gabbro on top of data from Hole 735B (Dick et al., 2002). Hole 1105A pyroxene data from this study appear to be broadly similar to Bushveld trend and Skaergaard trend if all of the Hole 735B and 1105A data are considered (e.g., also see Thy, Chap. 3, this volume). Data from both holes show similar trends. Below the quadrilateral line graphs are the corresponding Fo content in olivines for samples from Holes 1105A and 735B. An apparent gap in olivine composition seen in Hole 1105A is not visible in Hole 735B olivine data. Cpx = clinopyroxene, opx = orthopyroxene.


![]()