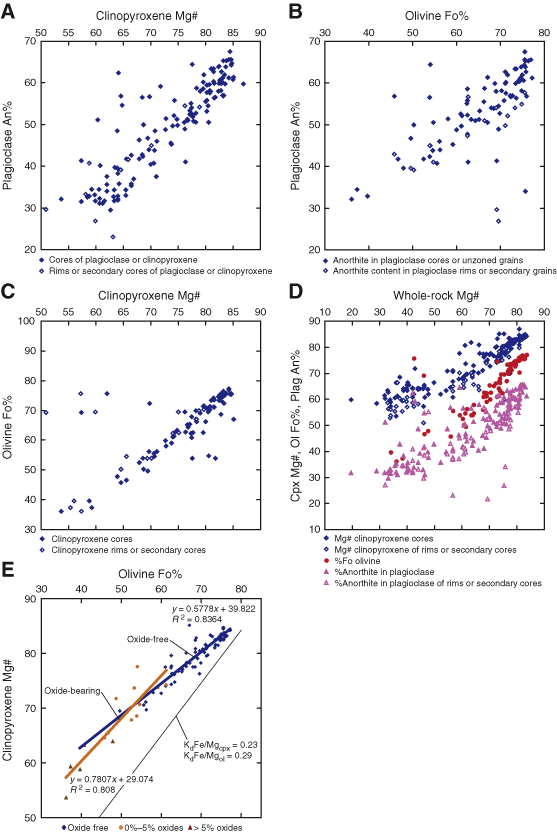
Figure F35. Correlation between (A) An content of plagioclase (plag) and Mg# of clinopyroxene (cpx), (B) An content of plagioclase and Fo content of olivine (Fo-OL), (C) Fo content of olivine and Mg# of clinopyroxene, and (D) An and Mg# of clinopyroxene, Fo content of olivine relative to the whole rock Mg#. (E) Fo vs. Mg# of cpx diagram, which at the primitive end lies close to the calculated FeO/MgO Kd between olivine-melt (0.29) and cpx-melt (0.23) trend of Grove and Bryan (1983), but most of the more fractionated samples lie significantly off the trend. This perhaps is due to reequilibration between trapped melt and olivine, changes in Kd of the melts with increasing fractionation, and/or subsolidus reequilibration. Linear best fit lines are provided for nonoxide and oxide bearing gabbroic rocks.


![]()