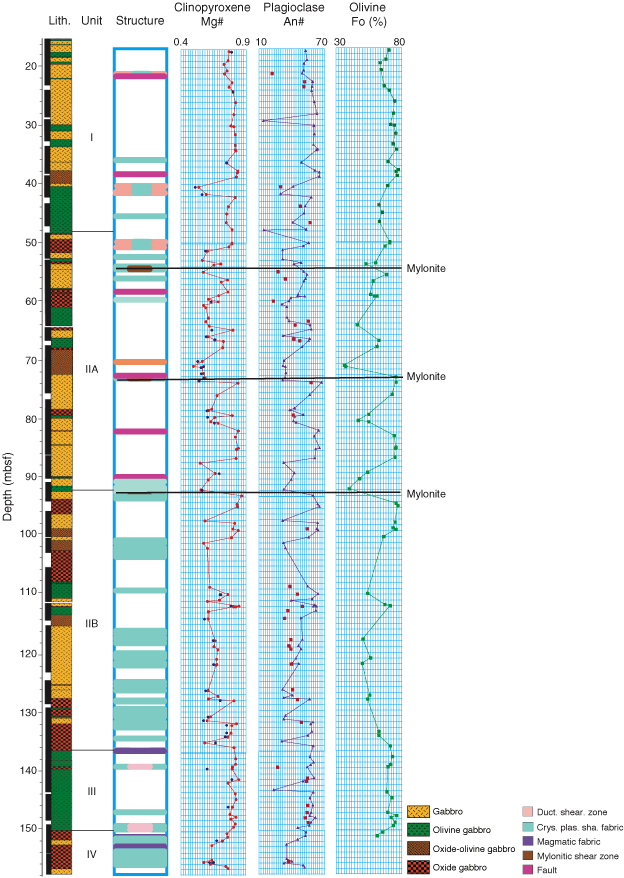
Figure F36. Downhole plot of Fo, An (Ca/[Ca + Mg + K]), and Mg# of clinopyroxene variations placed beside the lithologic and structural log. Note all three fractionation indexes correlate well (although there are fewer olivine analyses). Note positions of three narrow mylonite and many crystal-plastic fabric zones, which could represent significant breaks in the stratigraphy and do show compositional difference as they are crossed. Dots off trend lines indicate analyses of secondary cores or extent of grain rim zonation at various levels in the core.


![]()