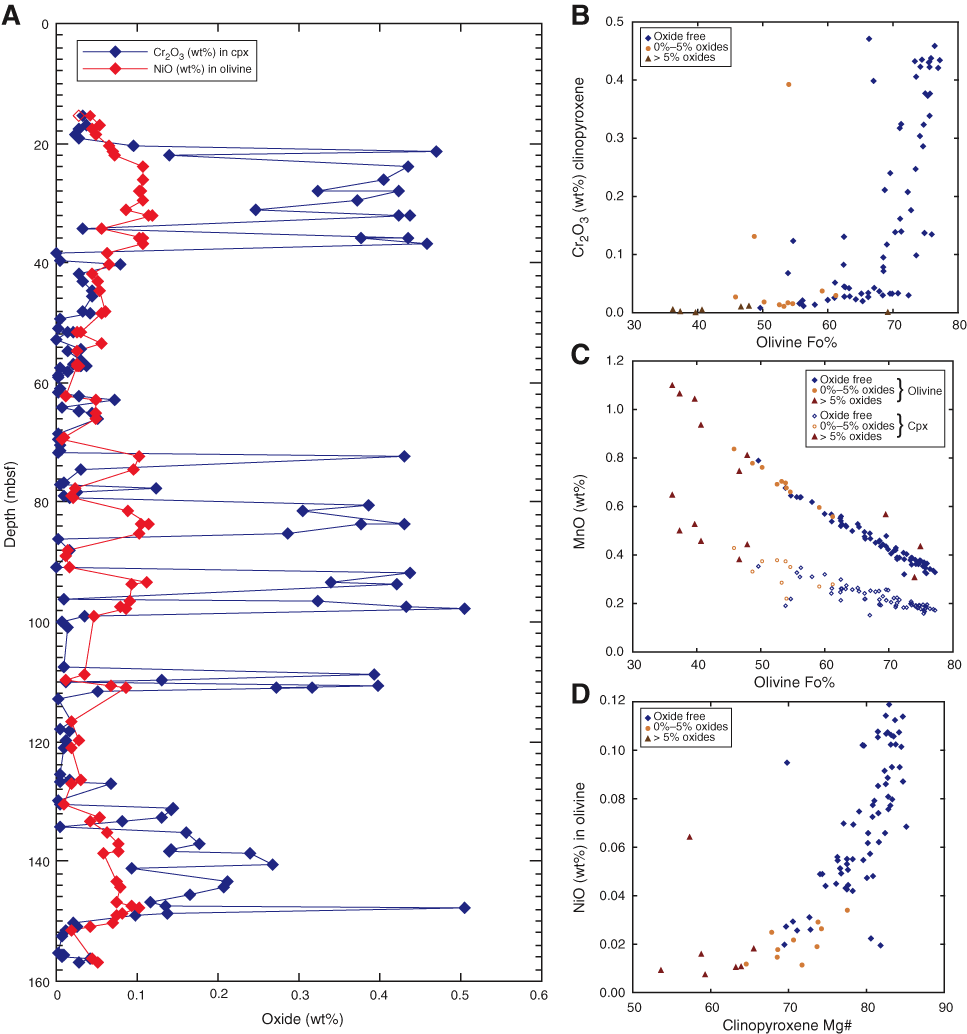
Figure F37. A. Plot showing downhole distribution of NiO in olivine and Cr2O3 in clinopyroxene (cpx) in Hole 1105A. The plot shows a good correlation between the two variables. B. Plot showing correlation between Fo in olivine and Cr2O3 in clinopyroxene. C. Plot showing relationship between olivine Fo% and MnO in both olivine and clinopyroxene. D. Plot showing the relationship between Mg# in clinopyroxene and NiO in olivine, showing a relatively good correlation. Data from Hole 1105A (this study) have been used for all four the plots. To preserve such good correlations, it is unlikely that the section has been significantly affected by postcumulus and highly allochthonous fractionated late-stage melt impregnation. Aberrant data from the main trend are, however, typically related to secondary cores (open symbols) and possible localized melt flow zones.