![]()
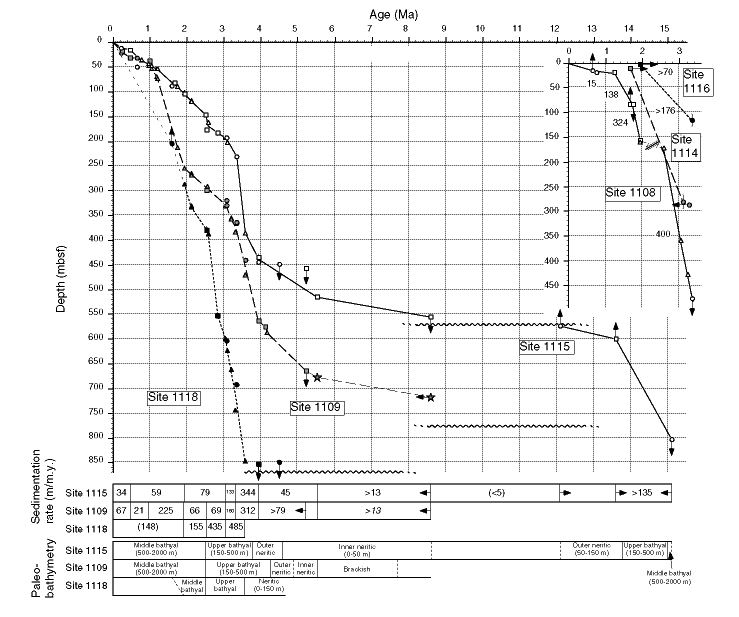
Figure F10. Sedimentation curves at Sites 1115 (solid line), 1109 (dashed line), 1118 (dotted line), 1108 (solid line upper right), 1114 (dashed line upper right), and 1116 (dotted line upper right), based on nannofossil (square) and planktonic foraminifer (circle) datum events, magnetic chron and subchron boundaries (triangle), and lithostratigraphic correlation (star), shaded to differentiate sites. Symbols with arrows denote actual datum point can be above or below and older or younger than indicated by the symbols. Wavy lines denote unconformities. Shown below are average sedimentation rates in meters per million years, calculated for intervals separated by vertical lines, and paleobathymetry, based on benthic foraminifers, at Sites 1115, 1109, and 1118. Broken lines indicate uncertainty in the placement of paleodepth boundaries.
![]()