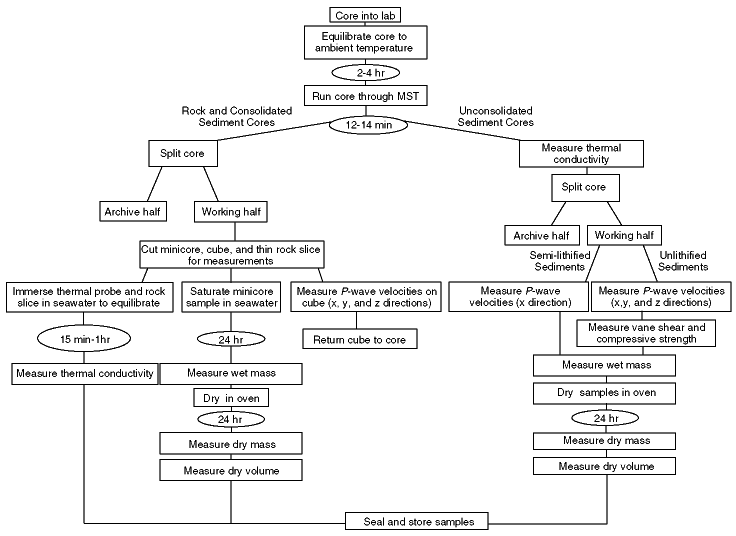
Figure F14. Flow chart depicting the sequence of physical properties measurements for both unconsolidated sediment and hard-rock cores analyzed during Leg 180.