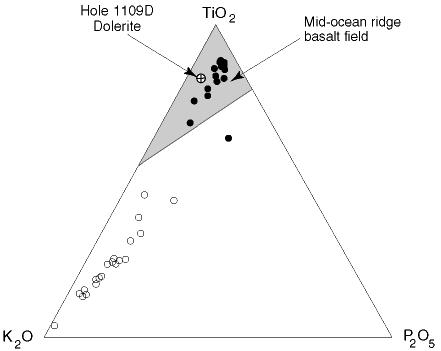
Figure F47. TiO2-K2O-P2O5 diagram from Pearce et al. (1977) showing Woodlark Island low-K tholeiites (solid circles) and high-K suite (open circles) along with average value for Hole 1109D dolerite. Oceanic basalts plot in the shaded field above the diagonal line in this diagram. Woodlark Island analyses from Ashley and Flood (1981).

![]()