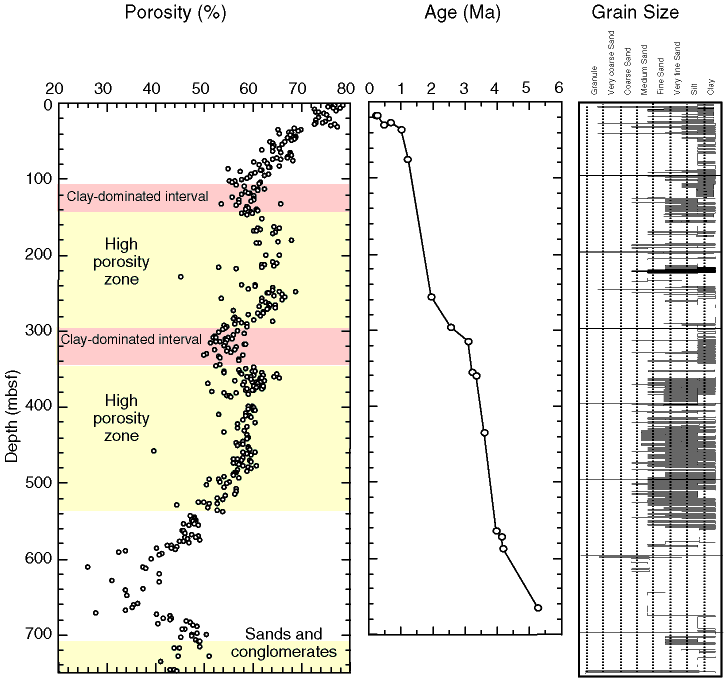
Figure F76. Comparison of porosity, sedimentation rate derived from biostratigraphy data, and grain-size distribution. Highlighted zones represent characteristic lithostratigraphies and porosity behavior; pink/intermediate gray = clay dominated intervals; orange/dark gray = sands and conglomerate; yellow/light gray = high porosity zones.

![]()