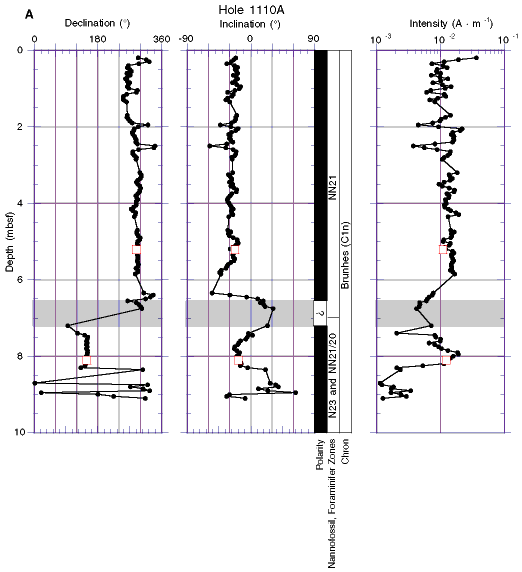
Figure F22. Downhole plots of declination, inclination, and intensity. (Data from long cores after AF demagnetization at 25 mT shown as filled circles; data from discrete samples after AF demagnetization at 25 mT shown as open squares.) Magnetostratigraphic interpretation and paleontologic zonation shown for Hole 1110A only. A. Hole 1110A. Shading represents possible excursion. Polarity: black = normal; white = reversed. Chrons: C1n = Brunhes (0.0-0.78 Ma; Berggren et al., 1995); ? = excursion, possibly the Blake event (~0.128 Ma; Harland et al., 1990). For paleontologic zonations, see "Biostratigraphy" in the "Sites 1110–1113" chapter. (Continued on next three pages.)

![]()