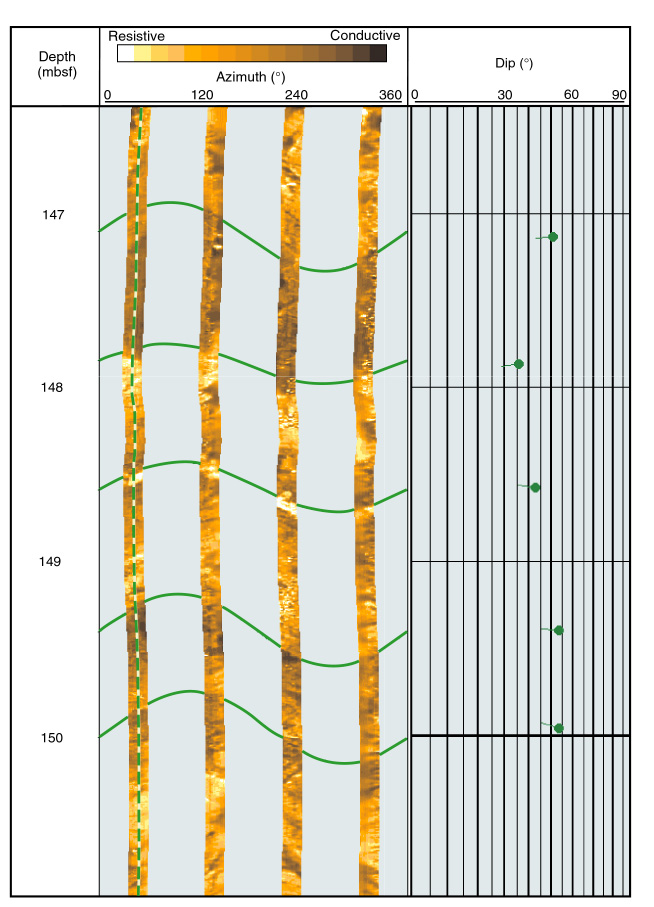
Figure F65. Hole 1114A statically normalized FMS image and tadpole plot from the upper portion of log Unit L3. Beds consistently dip westward from 35° to 50°. Fractures, if present, are poorly defined. Vertical scale = 1:20.