![]()
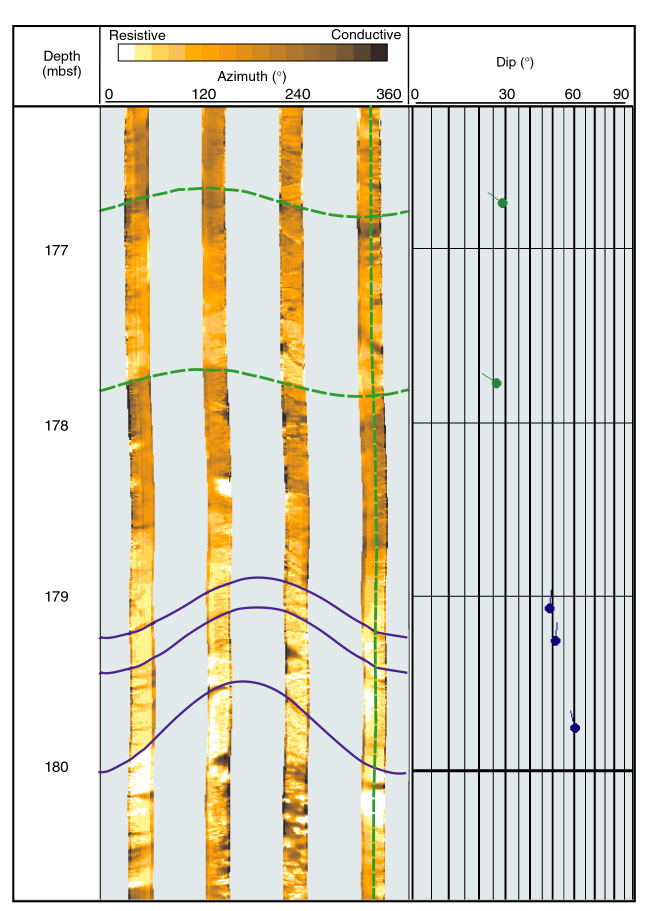
Figure F66. Hole 1114A statically normalized FMS image and tadpole plot from the lower portion of log Unit L3. The dipping beds and fractures shown lie near the top of the zone between 165 and 215 mbsf within which both bed and fracture dips steepen with depth. Vertical scale = 1:20.
![]()