![]()
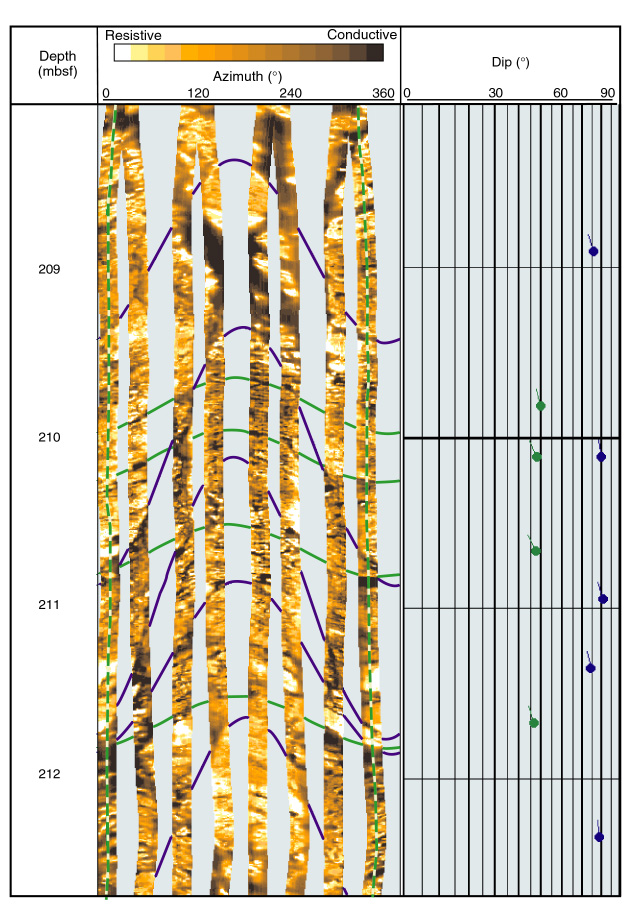
Figure F67. Hole 1114A dynamically normalized FMS image and tadpole plot from log Unit L4 showing steep (75°-80°) dipping fractures that crosscut more shallowly dipping (45°-50°) beds, both of which display a north-northwestward dip direction. Vertical scale = 1:20.
![]()