![]()
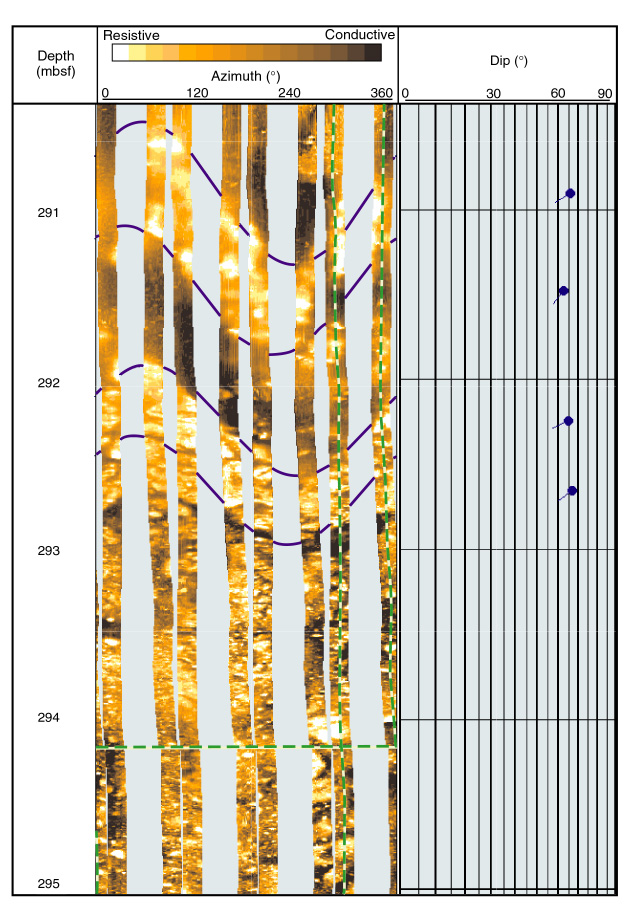
Figure F68. Hole 1114A dynamically normalized FMS image and tadpole plot from log Unit L5. Fracture-bound beds dip 65° to the southwest. Dark, conductive zones on either side of the resistive bed at 291 mbsf are washed out zones. Vertical scale = 1:20.
![]()