![]()
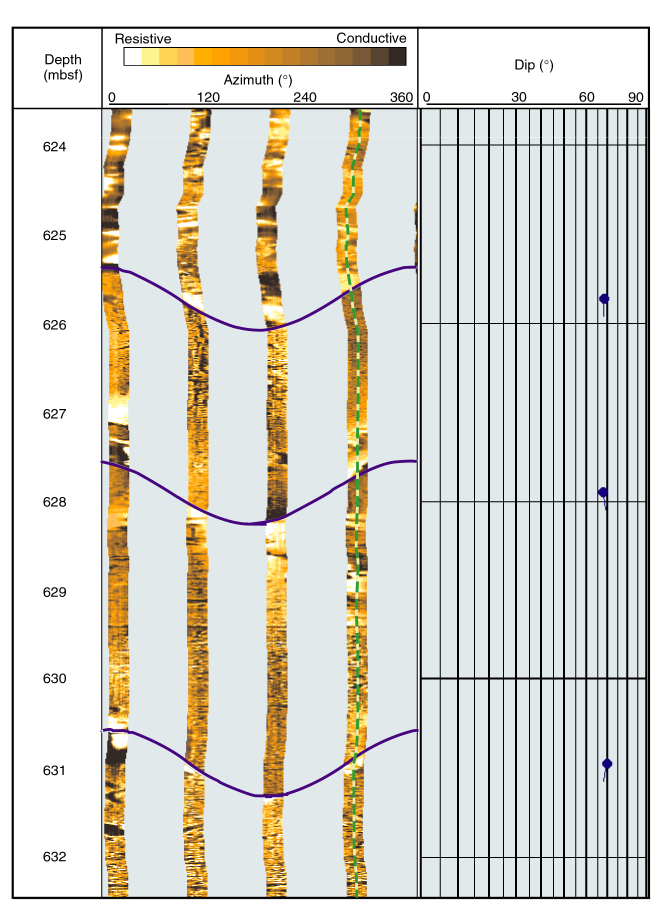
Figure F73. Hole 1115C dynamically normalized FMS image and tadpole plot of the fractured interval at the top of log Unit L9. This fracturing probably contributed to the poor core recovery within the interval between Cores 180-1115C-36R and 39R (620-658 mbsf). The fractures dip ~70° to the south. Vertical scale = 1:40.
![]()