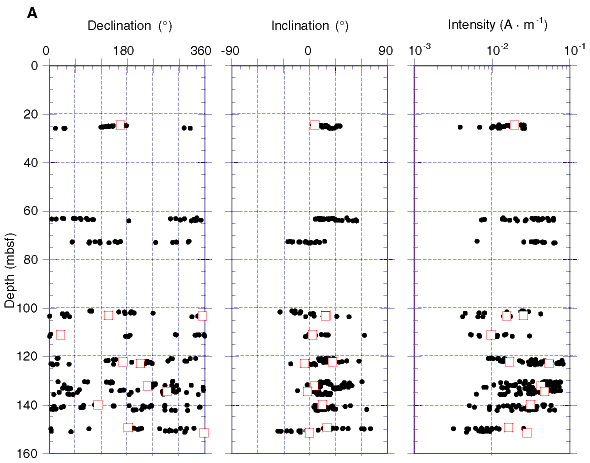
Figure F34. Downhole plots of declination, inclination, and intensity, Hole 1116A. Data from long cores after AF demagnetization at 20 mT are shown as solid circles; data from discrete samples after AF demagnetization at 25 mT are shown as open squares. A. Inclinations and declinations are shown uncorrected for bedding tilt. (Continued on next page.)

![]()