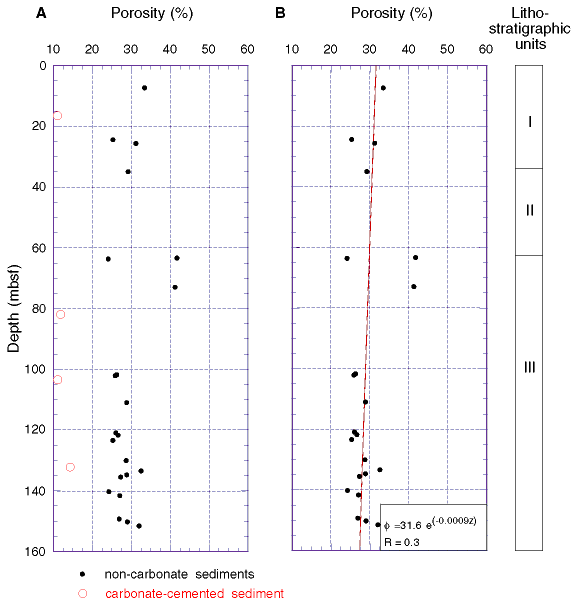
Figure
F36. Site 1116 profiles of (A) the
complete porosity data set and (B) the
porosity distribution without the carbonate-cemented
samples. Superposed is a least-squares exponential curve
using the data shown ( = porosity; z = depth). The estimated thickness of
the removed section is ~960 m. Note that a correlation
coefficient (R) of 0.3 indicates that the
quality of the least-squares regression is poor and that the
erosion estimate is preliminary because it is based solely
on data from Site 1116.

![]()