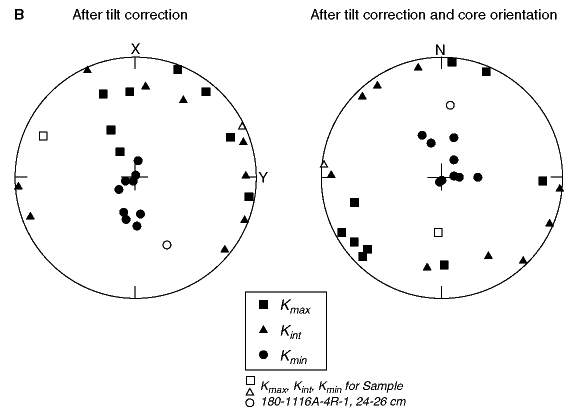
Figure F32 (continued.) B. Stereonet plots of the principal axes of the susceptibility ellipsoids corrected for bedding tilt and for core orientation. All symbols are projections on the lower hemisphere; open symbols used to highlight Sample 180-1116A-4R-1, 24-26 cm, which was the only sample from the upper part of the hole.

![]()