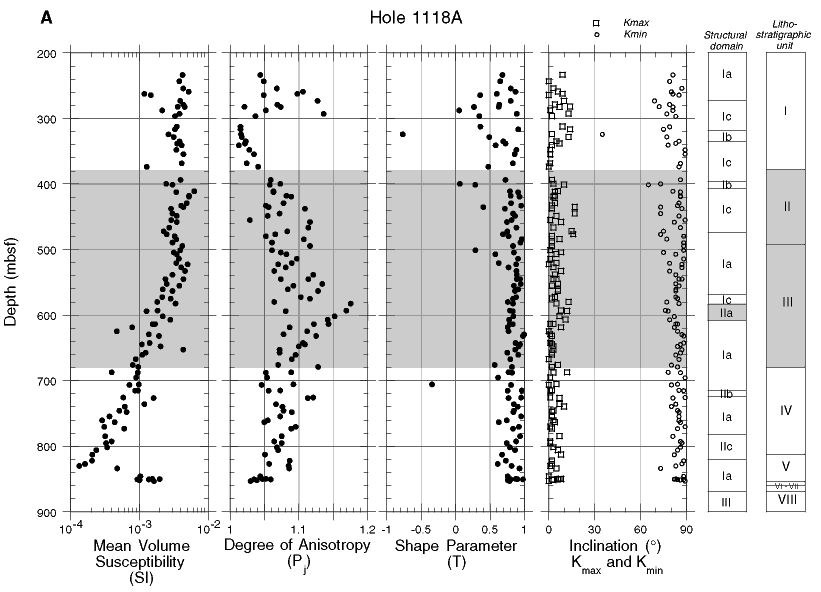
Figure F56. Susceptibility and its anisotropy (AMS) data for discrete samples from Site 1118. A. Downhole plots of the variation of AMS parameters. Degree of anisotropy (Pj) and the shape parameter (T) calculated according to Jelinek (1981). Lighter shading: interval in which the scatter in Pj values may be related to lithology (for lithostratigraphic units, see "Lithostratigraphy" in "Site 1118" chapter.). Darker shading: interval in which the scatter in AMS parameters may be related to structure (for structural domains, see "Structural Geology" in "Site 1118" chapter). (Continued on next page.)

![]()