![]()
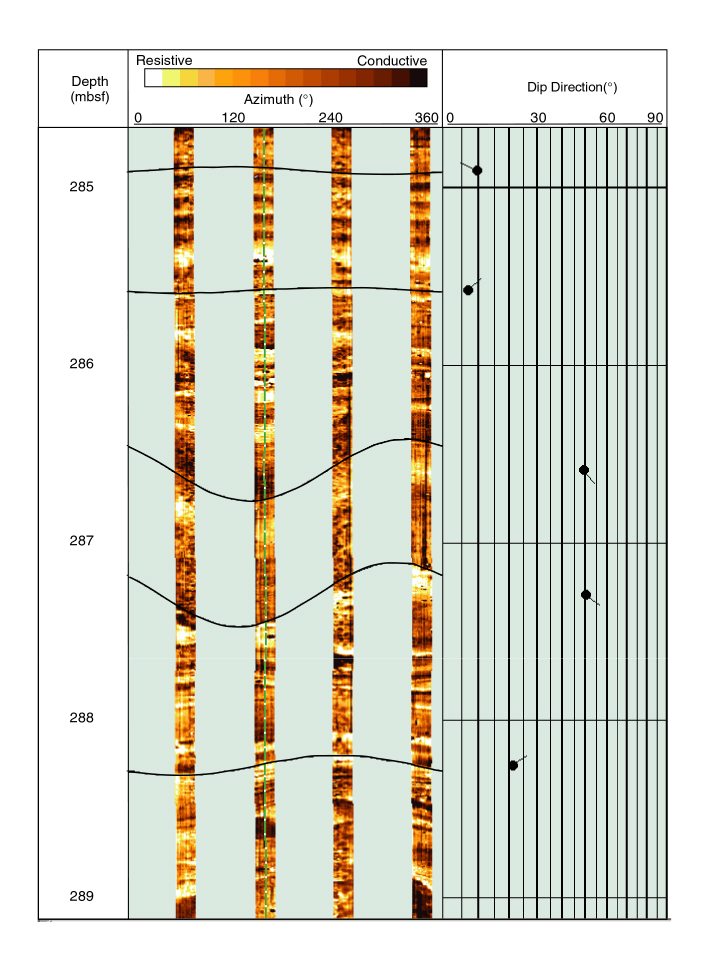
Figure F83. Hole 1118A dynamically normalized FMS image and tadpole plot displaying wavy beds and foresets at the base of log Unit L3. Tadpoles indicate the dip magnitude from 0° to 90°. Dip directions are indicated by the orientation of each tadpole tail. Vertical scale = 1:20.
![]()